Which are the best served software categories?
As Marc Andressen wrote in 2011, “Software will eat the world”. And, the market for software has indeed grown quickly over the last 10 years. Capterra, a review site for software platforms, now tracks over 700 different categories of software products. And, these categories span the gamut of almost any type of software you can think of, from “artificial intelligence software” to “zoo software.”
However, this doesn’t mean that every category is created equal. I wanted to get a sense of which of these categories are “best-served” (lots of really well-liked products) and which categories could use some more innovation.
So, I looked across categories, and pulled two numbers for each category. First, the number of companies in each category — this gives us a sense of either how big the market is or how saturated it is, but most likely a combination of the two. Second, I looked at the average rating of the Top 25 most reviewed platforms in that category — this gives us a sense of how well the leading companies in this sector are meeting the needs of this customer.
The Overall Results
Below, you can see the distribution of ~700 categories of software, encompassing 83,000 companies.

As you can see, there is wide dispersion in number of companies per category (on the x-axis, from single digits to almost 1000) and average rating of the most reviewed software (on the y-axis, from 4 to 5 — a perfect score).
On ratings, a quick aside — a 4 does not sound very different than a 5, aren’t both pretty good? Well, in these sort of review sites, as this HBR article says, ratings are “subject to grade inflation”. So, the difference between a 4 and a 5, or a 4.2 and a 4.7, may well be significant.
Anyway, having plotted out all of the categories, I then divided the graph into four quadrants.
“Well-served niches”, for categories with limited options but high scores.
“Well-covered, large markets”, for categories with lots of options and high scores.
“Crowded, but frustrated”, for categories with lots of options but lower scores (and likely frustrated users)
“Low ratings, limited options”, for categories with, you guessed it — limited options and lower ratings.
So, if I was thinking about this dispersion as an entrepreneur or investor, I would probably want to play in one of the bottom two quadrants. The bottom left quadrant (low ratings, limited options) would have the most white-space, as long as the market was large enough, while the bottom right quadrant might have lots of frustrated users that I could try to convert. So, which categories fall in these buckets?

These are the 5 top examples by grouping, which means the 5 highest rated categories in the top two quadrants and the 5 lowest-rated categories in the bottom two quadrants.
This is pretty interesting! In the “Crowded, but frustrated” quadrant, I think most of these categories are unsurprising. ERP systems are constantly subject to complaints, as are EMRs. However, the “Lower ratings, limited options” quadrants surfaced some categories I have not thought about. Some of these (e.g. Waitlist Software) reflect categories that have a few highly rated options, but have low barriers to entry, so also lots of less good options. However, others of these (e.g. SCADA) seem to genuinely have very few well-liked options. See full descriptions of these categories below:

I should note, for completeness, that Capterra considers a software with no reviews to have a score of “0”. So, the very low scores in some of these categories reflect having products in the Top 25 that have 0 reviews. I decided not to adjust these “unreviewed” products out of the analysis, though, as I think they fit with the broader point on competitive intensity — these are categories served by a higher proportion of products that have not achieved commercial traction.
The Industrial Results
I spend a lot of time looking at software applied to industrial applications, such as energy, manufacturing, and logistics. So, I also wanted to run this analysis only for software dedicated to those sectors. This segment reflects ~180 categories of software, with ~25K companies.

The industrial view shows a similar dispersion to the overall view, if a bit less crowded. And, actually, the average category rating is exactly the same — 4.47 for industrial software, 4.47 for all software.
Then, below are the top examples from each category.
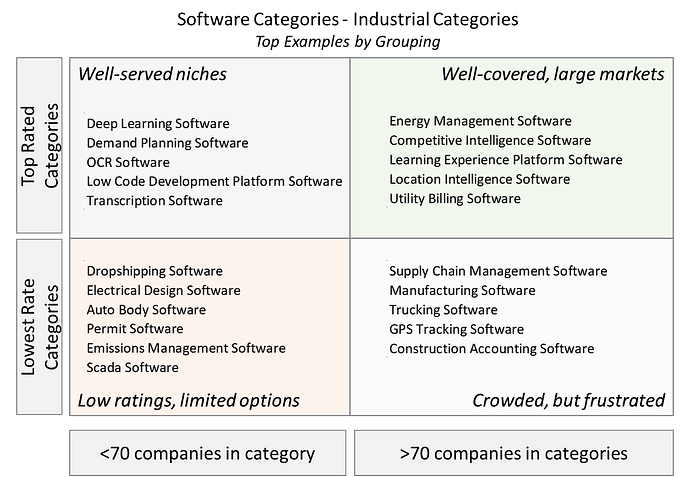
This is pretty interesting! The “Well-Served Niches” are all AI / ML software, including OCR (optical character recognition, an application of computer vision), transcription software (using AI to transcribe voice), Low Code (letting people develop AI applications without knowing how to code), Demand Planning (usually enabled by AI), and Deep Learning (just another word for AI). So, it seems that users have found some AI enabled use cases that they are impressed by!
In “Crowded but Frustrated”, I see a lot of categories that could each have many sub-categories. There are undoubtedly solutions that do well in each of these categories, but there also many use cases that have not been fully solved. Really interestingly, Location Intelligence Software is one of the top performing categories, while GPS Tracking is one of the worst. These seem very similar to me — but, Location Intelligence likely builds more analytics on the top of its solution, while GPS Tracking does not. So, I guess users appreciate that additional value!
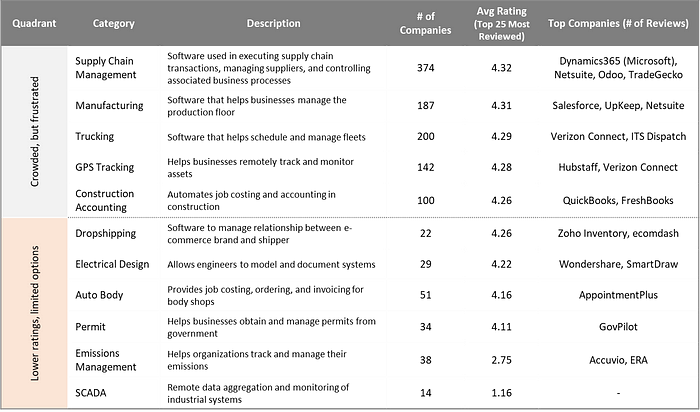
In the “Low Ratings, Limited Options” bucket, we see our old friend SCADA software, as well as some others. Emissions management software is interesting, because there are a lot of very early stage startups trying to build better solutions in this space right now! So, if these ratings reflect the state of the industry today, users will be open to trying new options. See full descriptions of the categories below:
So, anyway, if you are a potential software entrepreneur or a software investor, B2B software has become “consumerized” to the point that lots of public ratings and reviews exist on the internet. Check them out to learn more about the problems you might be able to solve!


